Wednesday, July 15, 2020

Application is facing issue while fetching data from Database

Application is facing issue while fetching data from Database

Application is facing issue while fetching data from Database

1. Check from console free server memory and number of free DB threads.
2. Take thread dump and analyse server logs which will provide detailed information,if in logs DB error codes are found,provide logs to DB team for their further analysis.
3. With the help of telnet command check whether we are able to connect to DB server or not,issue may be from port or firewall also.
4. If not able to connect successfully, log a ticket to Firewall team and also check with Unix team for any OS related issue.

Exception , Issues with Weblogic Server

Exception , Issues with Weblogic Server


1. Application URL is not accessing.
2. Application performing very slow.
3. Server is down, Crashed.
4. Server is Hang.
5. Database Exceptions.
6. Connection pool closed issues.
7. Space issues.
8. Deployment Issues.
9. File not found exceptions.
10. Out of memory Exception.
      Heap out of memory
      Perm gen space error
11. Null pointer exception.
12. Struck thread in Servers
13. CPU utilization is High
14. socket exceptions.
15. Too many open file exception.
16. Performance issues.
17. Port or listen address already used exception.
18. socket already used exception.
19. Proxy server exceptions
20. Node manager bind exception.
21. Authentication and Authorization. 

Creation and Installation of SSL Certificate for Key tool

SSL Configuration for WebLogic

How to Generate Certificate Using the Key tool for Weblogic

The keytool is special utility provided by the Java to work with Certificates and security stuff. Here in this we will let you know the each option that is useful to create java key store, sign the keystore and

Step 1 Set the WebLogic environment variables available with the PATH, CLASSPATH etc., by issuing C:\bea\weblogic91\server\bin\setWLSEnv.cmd

On UNIX environments, The profile will be set to work, otherwise you can make sure by running setWLSEnv.sh script from $WL_HOME/server/bin path.

Step 2 Create a dedicated folder (SSLCert- anywhere) to store all Certificate stuff in it. Here we made a folder name as ‘cert’ under c:\cert

Step 3  Generating a “sample.jks” file with java keytool command.


keytool -genkey -alias one -keyalg RSA -keystore sample.jks  


Note : Please don’t give space while entering your first name and last name as inputs you can enter as sample shown.

Step 4 Creating a certificate request using keytool with the following command


keytool -certreq -keyalg RSA -alias one -file certreq.csr -keystore sample.jks


Better choice to experiment with trail certificates on test environments. Please don’t use this scenario for production environment. Easy ways to get a kick start at Google and type SSL Certificate and open VeriSign website. Click on “Free 30 day SSL Trial”

Click on VeriSign @ SSL Test Certificate

Step 5

Your browser's padlock icon will be displayed in the locked position if your certificate is installed correctly and the server is properly configured for SSL.

Now you need to enter the data

Open C:\cert\certreq.csr file and copy the content as specified in the below screen and submit the certreq.csr

Click on Submit

You will get the Mail to your mail box as shown below

VeriSign will send you the Certificate file to your email that you enter while registering. There are two important  certificate links

1. Root CA certificate

2. Intermediate CA certificate

Click on each link as shown in the lower side of email message that is for download.

Download the Root CA  

Click the link


Click on select all button and copy in to one text file in C:\bea\SSLCert and named it as CA.pem Go to second link which is given in the email. Do the same for intermediate CA certificate as well.

Copy the content and saved as public.pem

Total 3 files

Step 6: To understand these .pem files to Keytool, We need to follow below steps


keytool -import -alias verisignCA -file CA.pem -keystore sample.jks -trustcacerts


keytool -import -alias verisignIntermediateCA -file Intermediate.pem -keystore sample.jks -trustcacerts


Step 7  converting to trusted


keytool -import -alias one  -file public.pem -keystore sample.jks -trustcacerts


Note : While saving don’t include any spaces in public.pem file

By using below command check all the reports are successfully imported or not

Step  8


keytool -list -keystore mykeystore.jks -v


Go to WebLogic console and enable SSL port

(domain -> adminserver->configuration -> general)

Go to keystore tab.

For SSL Tab add the following changes

Now, restart the WebLogic admin server, open the admin server logs file it will show the following information

Enable Admin server using SSL Port

When you browser with https first time it will be like this…

Now SSL configuration completed.  You can verify that use the https://localhost:7002/console there is no Root CA Certificate in your Browser, install RootCA certificate in your browser

Click on Yes button


DataSource and Connection Pooling

DataSource and Connection Pooling


Thread Dump

Thread Dump


Thread dump provides a snapshot of the current active live threads. It provides the stack trace of all the java threads in the JVM. It is used when the server is hung and we want to see the threads executing and take their dump.

There are different ways to take thread dump.

1.Command line:  use the below command when you know the port number. just run the same command 3 times in 5 sec intervel of gaps.
kill -3 PID

2.WebLogic.Admin utility:  javaWebLogic.Admin adminurl -username WebLogic -password WebLogic1 THRED_DUMP

3.Admin console: 
Step1: login to the admin console
Step2: Click on server
Step3: Navigate to servers
Step4: Click monitor tab
Step5: Click on tread
Step6: Click on the dumpthread stack.

Location of the Thread Dump:  
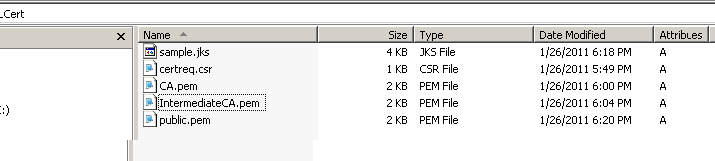
/DOMAIN_NAME/servers/logs/KK_stdout.log

======================================================

Thread Dump:

  1. What is Thread dump?
  2. When we will take Thread dump? (Scenarios)
  3. How  Many  ways take Thread Dumps
  4. Thread Dump Generating Procedure
  5. What can I Analysis with Thread Dump?
  6. How can I analysis thread dump?
  7. Actions taken for Issue resolving
  8. References


Coming to step by step learning:
--------------------------------

What is Thread dump?

Thread Dump is a textual dump of all active threads and monitors of Java apps running in a Virtual Machine.

When we will take Thread dump? (Scenarios)

1.  Scenario 1: when server is hang Position, i.e. that time server will not respond to coming requests.

2.  Scenario 2: While sever is taking more time to restart

3.  Scenario 3: When we are Getting exception like “java.lang.OutOfMemoryException”

4.  Scenario 4: Process running out of File descriptors. Server cannot accept further requests because sockets cannot be created

5.  Scenario 5: Infinite Looping in the code


How many ways take Thread Dumps?

Many types we have to take a Thread dumps. As per your flexibility you can choose one Procedure. For analyzing take dumps some Intervals (like every 10mins, 10mins etc.).


Generating Dump Talking Procedures

1. Take Thread dump from Console by Using of below command
    $kill -3 PID
   (For Getting PID, Use this Command ps –ef | grep “java”)
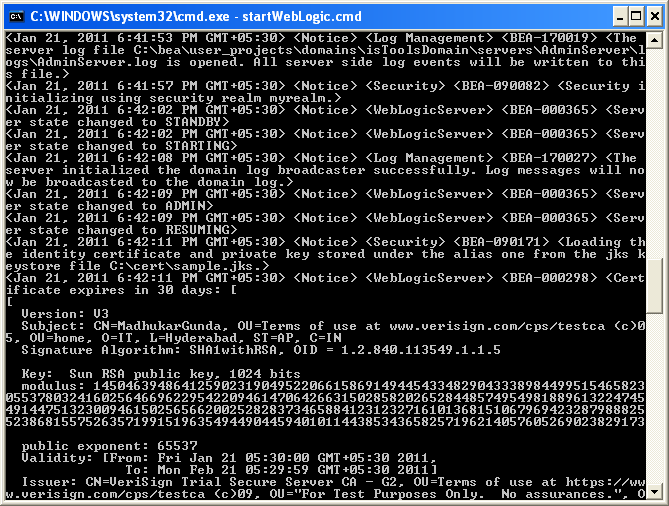
Here The Output of the Thread Dump will be generated in the Server STDOUT.
(Note: If a process is not responding to kill -3 then it’s a JVM bug.)


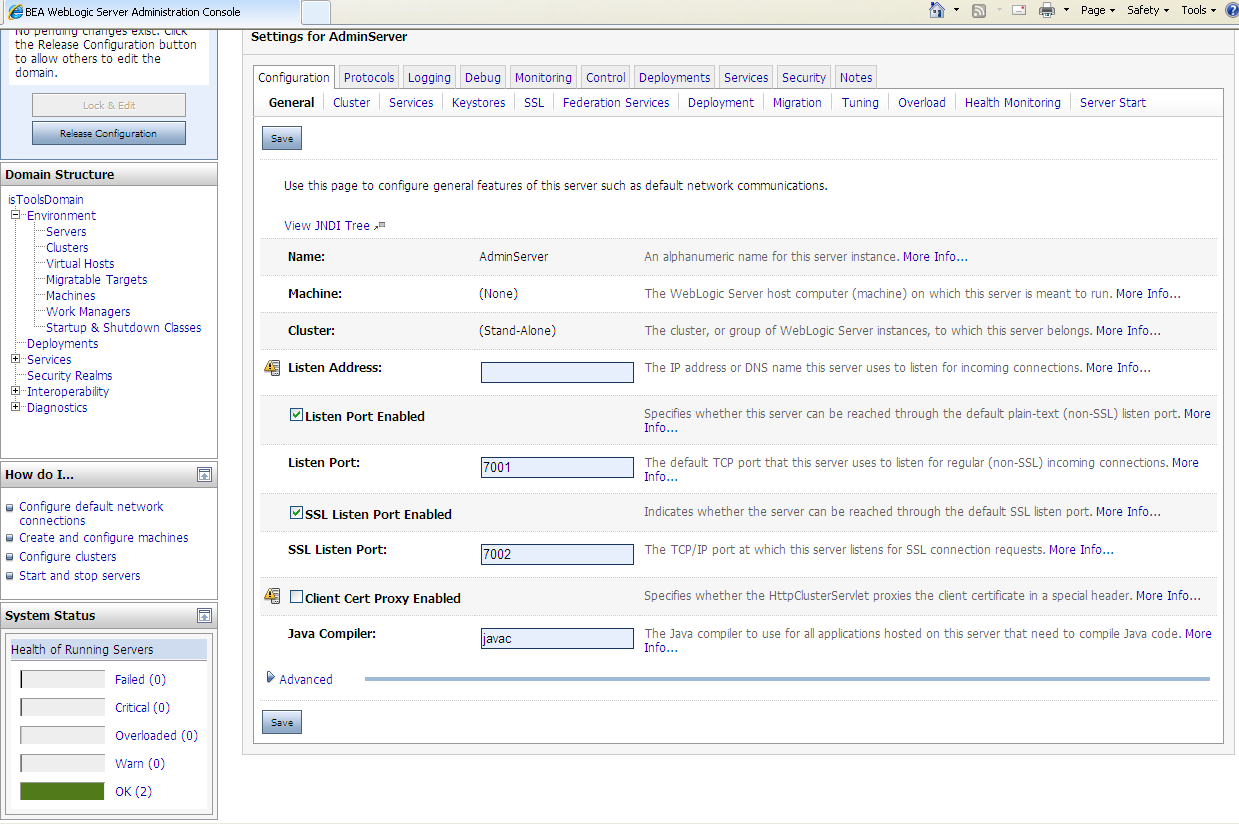
2. Generation Thread Dump via Admin Console

a.  login to Admin Console(with Admin Username/Password)
b.  Click on Server, after choose your server
c.  Goto Monitoring TAB
d.  Goto Threads TAB, after click on “Dump Thread Stack” Button
e.  Now you can view the all the Threads in Same page
f.  Copy and paste in a txt file.

3.  We can Collect Thread Dump Using “WebLogic.Admin” which is deprecated, but still available or may be available in near future as well As i think because it is one of the best debugging utility for Admins.

  java WebLogic.Admin -url t3://hostname: port -username Weblogic -password Weblogic THREAD_DUMP


This Thread Dumps will be generated in Servers STDOUT file


4. Getting Thread Dumps by using Jstack Utility

    a.jstack –m  (to connect to a live java process)

    b. jstack –m [server_id@]
                (to connect to a remote debug server)
    (-m Means print both java and native frames (mixed mode)) 

5. By Using WLST Script, can contain extension of (.py)

connect(‘weblogic’,'weblogic’,'t3://hostname:port′) cd (”Servers’) ls() cd (‘AdminServer’) ls() threadDump()

 Execute this Script in console. 

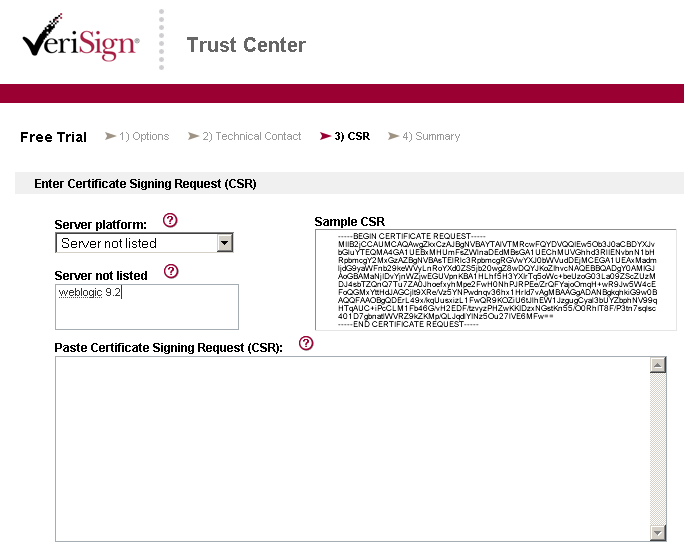
What can I Analysis with Thread Dumps?
We need to analyze the thread dumps for analyzing running threads and their states to identifying.

How can I analysis thread dumps?

For analyze thread dumps we have lots of tools to understand easily thread states

1.  samurai tool :

    In this tool you can identify all the Thread states by     identifying colors. We need to take care about Deadlocks and waiting state threads.

   More Details:

    $ java -jar samurai.jar

     After running we will get a Screen like below


     Goto Thread dump tab
    When Samurai detects a thread dump in your log, a tab named "Thread Dump" will appear.


You can just click "Thread dumps" tab to see the analysis result. Samurai colors idle threads in gray, blocked threds in red and running threds in green. There are three result views and Samurai shows "Table view" by default. In many case you are just interested in the table view and the sequence view. Use the table view to decide which thread needs be inspected, the sequence view to understand the thread's behavior. You should takecare especially threds always in red.


2.  TDA Tool :

 Actions taken for Issue resolving

1.  Classic Dead Locks : Look for the threads waiting for monitor entry

For Example :

"ExecuteThread: '95' for queue: 'default'" daemon prio=5 tid=0x411cf8 nid=0x6c waiting for monitor entry [0xd0f80000..0xd0f819d8]
    at weblogic.common.internal.ResourceAllocator.release(ResourceAllocator.java:766)
    at weblogic.jdbc.common.internal.ConnectionEnv.destroy(ConnectionEnv.java:590)
Reason: The above thread is waiting to acquire lock on Resource Allocator object. The next step is to identify the thread that is holding the Resource Allocator object
"ExecuteThread: '0' for queue: '__weblogic_admin_rmi_queue'" daemon prio=5 tid=0x41b978 nid=0x77 waiting for monitor entry [0xd0480000..0xd04819d8]
    at weblogic.jdbc.common.internal.ConnectionEnv.getPrepStmtCacheHits(ConnectionEnv.java:174)
    at weblogic.common.internal.ResourceAllocator.getPrepStmtCacheHitCount   (ResourceAllocator.java:1525)
Reason: This thread is holding lock on source Allocator object, but is waiting for Connection Env object. This is a classic deadlock.


2.  Threads in wait() state:
   A sample dump:

"ExecuteThread: '10' for queue: 'SERV_EJB_QUEUE'" daemon prio=5 tid=0x005607f0 nid=0x30 in Object.wait() [83300000..83301998]
  at java.lang.Object.wait(Native Method)
  - waiting on <0xc357bf18> (a weblogic.ejb20.pool.StatelessSessionPool)
at weblogic.ejb20.pool.StatelessSessionPool.waitForBean(StatelessSessionPool.java:222)

Reason: The above thread would come out of wait() under two conditions
 (Depending on application logic)
1) One of the thread available in the execute queue pool would call notify() on this object when an instance is available. (If the wait() is indefinite).
  This can cause the thread to hang for ever if server never does a notify() to this object.

2) If the timeout exceeds, the thread would throw an exception and back to execute queue thread pool.

Configure Apache with Weblogic Server

Configure Apache with Weblogic Server


Steps to configure Apache plugin 2.2 with Weblogic Server :


- Download the latest plugin from the link below :
Link : http://www.oracle.com/technetwork/middleware/ias/downloads/wls-plugins-096117.html
- Now unzip the file that you have downloaded. ( Eg : WLSPlugin1.1.zip ).
- Now copy all the files present under ” WLSPlugin1.1\Apache_2.2\lib ” to ” /bin ” folder.
( Note : Do not copy ” libapr-1.dll ” ).
Copy ” mod_wl.so ” from  ” WLSPlugin1.1\Apache_2.2\lib ” to ” APACHE_HOME/modules ” folder
- Take a backup of httpd.conf file present in ” APACHE_HOME\conf\ ” folder.
- Edit the httpd.conf file and make the following changes 
# for a single server


LoadModule weblogic_module modules/mod_wl.so

<IfModule mod_weblogic.c> 
WebLogicHost 127.0.0.1 
WebLogicport 7001
MatchExpression *
Debug ON
WLLogFile c:/global_proxy1.1.log
DebugConfigInfo On 
</IfModule&gt


<Location > 
SetHandler weblogic-handler 
</Location >

 Now start the Apache server and weblogic server.
- Access http://localhost:7001/console

****************************************************************************** Configure Apache with Weblogic Server

Step 1) Make sure the Apache server runs on port 8080.
(This is because sometimes IIS, or some antivirus softwarew runs on that port).
This can be done by modifying the httpd.conf present at,
\Apache2\conf\httpd.conf

Modify the Listen port to 8080

Step 2) Copy the mod_wl_20.so from \wlserver_10.3\server\plugin\win\32 to
\Apache2\modules
Step 3) Add these lines in the httpd.conf file
 LoadModule weblogic_module modules/mod_wl_20.so

<Location />
SetHandler weblogic-handler
</Location>

<IfModule mod_weblogic.c>
      WebLogicCluster localhost:7003 ,localhost:7005
     Debug ON
     WLLogFile c:/temp/wlproxy.log
     WLTempDir c:/temp
</IfModule>


Step 4) Restart Apache and access the application deployed on the Cluster using
http://localhost:8080/YourApp

This will forward the request to the Weblogic Cluster
You can check the headers sent and received to WLS in wlproxy.log file.

Node Manager

Node Manager


Node Manager in Oracle Weblogic Server


Node Manageris Weblogic Server utility to startstop and restart Admin and Managed Server Instances from remote location.
1. Node Manager Process is associated with a Machine and NOT with specific Weblogic Domain (i.e. Use one node manager for multiple domains on same machine)
2. There are two versions of Node Manager - Java-based and Script-based
Java-based node manager - runs with in JVM (Java Virtual Machine) Process and more secure than script-based node manager. Configuration for java-based node manager are stored in nodemanager.properties
Script-based node manager - is available for Linux and Unix systems only and is based on shell script.
3. There are multiple ways to access Node Manager
- From Administration Console : Environments -> Machines -> Configuration -> Node Manager
- JMX utilities (Java Management eXtension) 
- WLST commands (WebLogic Scripting Tool)
4.Default port on which node manager listen for requests is localhost:5556, When you configure Node Manager to accept commands from remote systems, you must uninstall the default Node Manager service, then reinstall it to listen on a non-localhost (IP’s other than 127.0.0.1) listen address.
5. Any domain created before creation of Node Manager Service will not be accessible via node Manager(even after restarting node manager), solution is to run the WLST command “nmEnroll” to enroll that domain with the Node Manager.
6. Any domains created after the Node Manager service has been installed should not have to be enrolled against the Node Manager. The Node Manager should automatically be ‘reachable‘ by the domain.

How to Configure Node Manager ?
1.Configure each computer (on which you wish to use Node Manager) as a Machine in WebLogic Server
Environments -> Machines -> New (Add Machine)
Environments -> Machines -> Machine Name (created above) -> Configuration -> Node Manager

2. Assign each server instance to Machine.
Environments -> Machines -> Machine Name (created above) -> Configuration -> Servers -> Add (Add Server running on this node which you would like to monitor using Node Manager)

3. Enroll domain (created before installation of Node Manager) to Node Manager
Unix /Linux
cd $BEA_HOME/user_projects/domains//bin/
setDomainEnv.sh
java weblogic.WLST
wls> connect(’weblogic’,'weblogic’, ‘t3://mymachine.mydomain:7001′)
wls> nmEnroll(’$BEA_HOME/user_projects/domains/’, ‘$BEA_HOME/wlserver_/common/nodemanager’)
where “mymachine.mydomain:7001″ is the reference to the Admin Server of the domain to which the server and machine definition belongs

How to start Node Manager ?
$WL_HOME\server\bin\startNodeManager.sh (startNodeManager.cmd on Windows)

Important Configuration files
– $WL_HOME/common/nodemanager/ nodemanager.properties, nodemanager.domains, nm_data.properties
–$DOMAIN_HOME/config/nodemanager/nm_password.properties

–$DOMAIN_HOME/servers//data/nodemanager/ boot.properties, startup.properties, server_name.addr, server_name.lck, server_name.pid, server_name.state

Node Manager Log Files
$WL_HOME/common/nodemanager/nodemanager.log